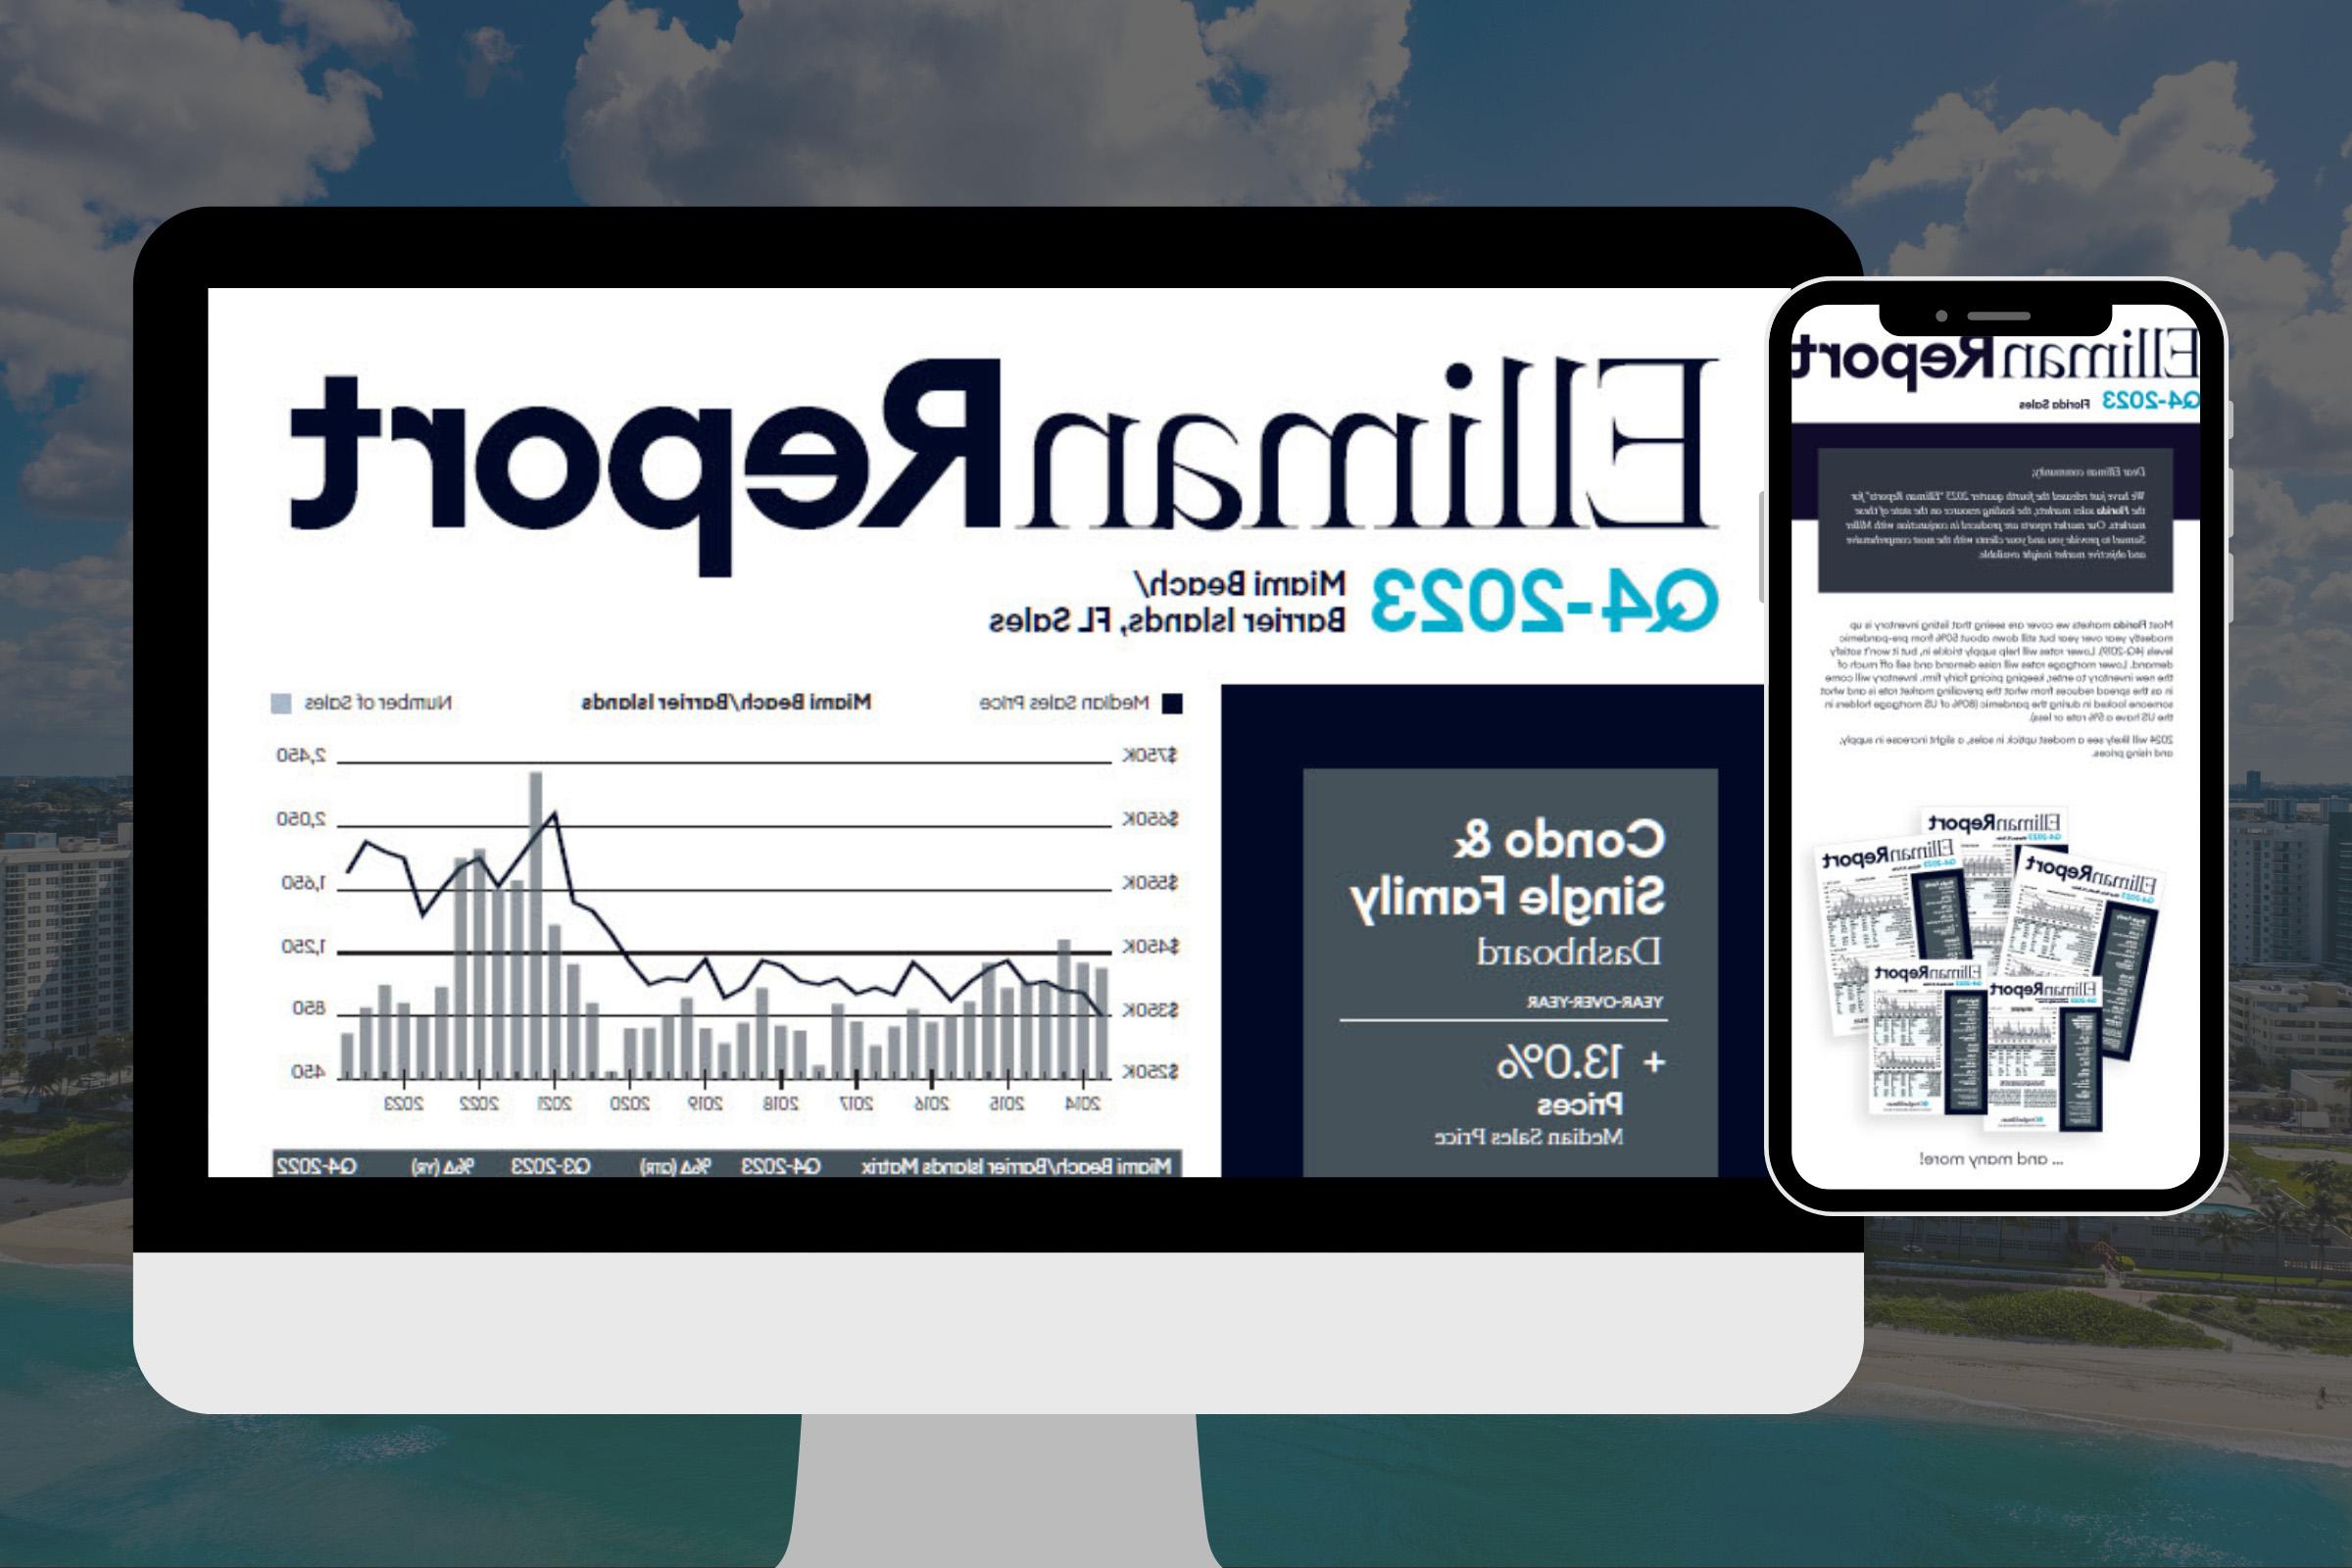

I am pleased to share with you my annual Coconut Grove statistics report highlighting that, yet again, Coconut Grove has outpaced a cooling national real estate market by setting new, all-time records across multiple categories!
Herein, I have compiled and analyzed the 2023 statistics, per MLS data, by hand-calculating the stats to ensure they are accurate for our readers. This information allows you to see for yourself the market trends in our community.
I would also like to note the reason I have been so passionate and adamant about publishing the Coconut Grove sales analytics annually for the past 10 years is that I am a Groveite through and through. I truly care about the health of our community and helping my neighbors, and future neighbors, fully understand where the Grove housing market has been and the direction it is headed.
Further, the Grove holds a dear place in my heart for an array of reasons…I met my wife in the Grove 15 years ago, we got married at St. Hugh with our reception held at the historic Villa Woodbine, I am currently the Executive Director of luxury Sales at Douglas Elliman Real Estate in our Two CocoWalk office, my wife and I have lived in Coconut Grove together for 13 years and are raising our daughter and 2 rescue dogs in our home in North Grove.
The overall market in South Florida exploded in 2021 and continued in 2022 due to an enormous influx of buyers from New York, Chicago and L.A. because of our favorable tax rates, Covid and “the way that Florida is being run” – (that last one being the most popular answer when asking buyers “why Florida?”). Then, in 2023, our neighborhood shattered all previous years. Many people believed we had truly hit the “top” of the market in 2022 and it would be impossible to continue…well, those people were wrong.
The Coconut Grove real estate market had increased year-over-year for 9 consecutive years until it exploded during the Covid bounce of 2020-2022…and then topped those numbers in 2023 by most metrics. Here are some takeaways from the 2023 numbers:
- Number of sales dropped 22.6% over last year, but total sales volume in ALL of the Grove went up slightly to $858,164,400; because…
- The average sales price in ALL of the Grove set another new, all-time high at $2,364,089, a 30% jump over 2022 and a whopping jump of 144.2% from $968,237 in 2019 (pre-Covid).
- The average sales price per square foot in ALL of the Grove also set another new, all-time high at $929.79, a 14.3% jump over 2022 and a ridiculous 115.3% jump over the pre-Covid 2019 high of $431.92.
- South Grove was the first neighborhood to EVER have both the average ($1,195.04) and median ($1,130.42) price per sq/ft over $1,100 in 2023!
- The average sale price in NORTH Grove jumped 37.8% year-over-year, one of the highest jumps ever recorded.
Coconut Grove Real Estate – Months of Supply (February 2024)
Months of supply means how long it would take for the market to absorb all real estate, if no additional real estate came to market. This stat determines whether it is a Buyer’s Market or Seller’s Market. When looking at statistics, having a 6-month supply or less favors sellers while more than 6 months favors buyers. Any supply that is 6-9 months is considered a stable market.
Single-Family Homes: 8.5-Month Supply (Buyer’s Market)
92 Currently Available
65 Sold in Past 6 Months
Condos: 8.9-Month Supply (Buyer’s Market)
104 Currently Available
70 Sold in Past 6 Months
Townhomes: 6.5-Month Supply (Balanced Market)
24 Currently Available
22 Sold in Past 6 Months
Below, I have laid out all of the 2023 Coconut Grove real estate statistics and then a year-over-year comparison of 2023 versus 2022.
2023 Coconut Grove Real Estate Sales by the Numbers:
- Total Number of Sales: 363
- Total Sales Volume: $858,164,400
- Average List Price: $2,567,773
- Median List Price: $1,649,900
- Average Sales Price: $2,364,089 (92.1% of List Price)
- Median Sales Price: $1,530,000 (92.7% of List Price)
- Average Sales Price Per SQ/FT: $929.79
- Median Sales Price Per SQ/FT: $810.81
- Days on Market: 71 Average / 36 Median
- Highest Priced Sale of 2023: Grove at Grand Bay LPH-S Closed on 08/31/2023 @ $19,250,000 ($2,023.55 per sq/ft)
- Lowest Priced Sale of 2023: 3245 Virginia St. #18 Closed on 06/26/2023 @ $255,000 ($496.11 per sq/ft)
Download: 2023 ALL Coconut Grove Real Estate Sales Data
2023 vs. 2022 ALL Coconut Grove Sales Year-Over-Year Numbers:
- Total Number of Sales: DOWN 106 (-22.6%) | 363 in 2023 vs. 469 in 2022 (800 in 2021)
- Total Sales Volume: UP $2,393,354 (+0.3%) | $858,164,400 in 2023 vs. $855,771,046 in 2022 ($1,452,047,154 in 2021)
- Average List Price: UP $670,891 (+35.4%) | $2,567,773 in 2023 vs. $1,896,882 in 2022 ($1,913,996 in 2021)
- Median List Price: UP $250,900 (+17.9%) | $1,649,900 in 2023 vs. $1,399,000 in 2022 ($1,172,500 in 2021)
- Average Sales Price: UP $539,417 (+30.0%) | $2,364,089 in 2023 vs. $1,824,672 in 2022 ($1,815,059 in 2021)
- Median Sales Price: UP $180,000 (+22.7%) | $1,530,000 in 2023 vs. $1,350,000 in 2022 ($1,100,000 in 2021)
- Average Sales Price Per SQ/FT: UP $176.65 (+14.3%) | $929.79 in 2023 vs. $813.28 in 2022 ($636.63 in 2021)
- Median Sales Price Per SQ/FT: UP $155.80 (+14.5%) | $810.81 in 2023 vs. $708.44 in 2022 ($552.64 in 2021)

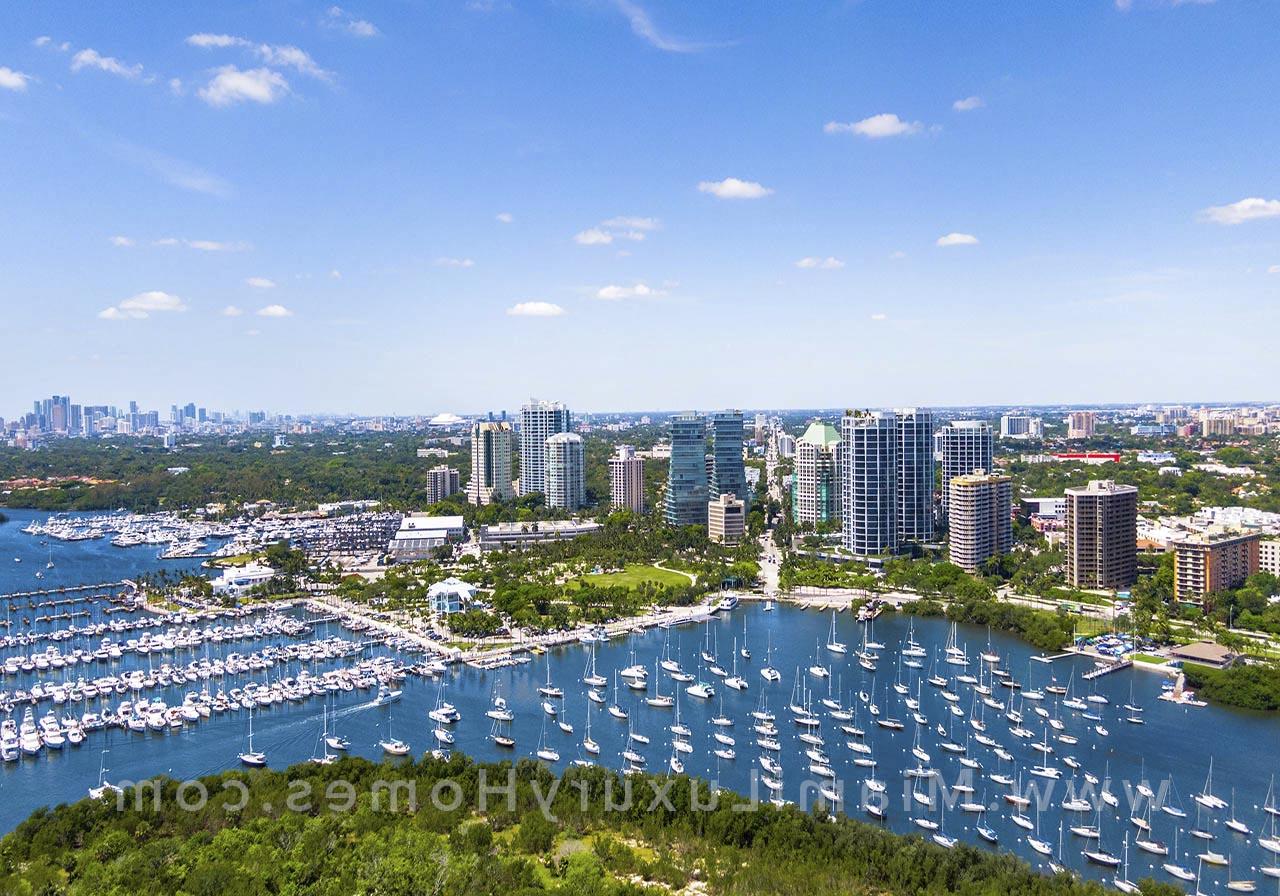
Coconut Grove Neighborhoods Map
To local Groveites looking to sell, and buyers purchasing property in Coconut Grove, I have broken down the statistics of the different areas of the Grove. Coconut Grove is locally referred to in parts, i.e. North, South, Center and West (for example, CocoWalk and Mr. C Hotel are both located in Center Grove and Kennedy Park is located in North Grove).
2023 vs. 2022 NORTH Coconut Grove Sales by the Numbers:
- Total Number of Sales: 125 in 2023 | 155 in 2022 (281 in 2021)
- Average List Price: $3,438,991 in 2023 | $2,368,218 in 2022 ($2,080,521 in 2021)
- Median List Price: $2,300,000 in 2023 | $1,975,000 in 2022 ($1,349,000 in 2021)
- Average Sales Price: (+37.8%) $3,109,000 in 2023 | $2,255,965 in 2022 ($1,954,750 in 2021)
- Median Sales Price: (+14.6%) $2,100,000 in 2023 | $1,833,000 in 2022 ($1,300,000 in 2021)
- Average Sales Price Per SQ/FT: (+14.6%) $996.95 in 2023 | $869.96 in 2022 ($649.80 in 2021)
- Median Sales Price Per SQ/FT: (+6.4%) $863.42 in 2023 | $811.79 in 2022 ($596.97 in 2021)
- Days on Market: 90 Average | 54 Median in 2023 (50 Average | 30 Median in 2022)
- Highest Priced Sale of 2023: Grove at Grand Bay LPH-S Closed on 08/31/2023 @ $19,250,000 ($2,023.55 per sq/ft)
- Lowest Priced Sale of 2023: 2539 S. Bayshore Dr. #228E Closed on 10/18/2023 @ $265,000 ($815.38 per sq/ft)
2023 vs. 2022 SOUTH Coconut Grove Sales by the Numbers:
- Total Number of Sales: 31 in 2023 | 40 in 2022 (112 in 2021)
- Average List Price: $5,042,430 in 2023 | $4,239,297 in 2022 ($3,792,882 in 2021)
- Median List Price: $3,175,000 in 2023 | $3,172,500 in 2022 ($2,287,450 in 2021)
- Average Sales Price: (+8.4%) $4,409,871 in 2023 | $4,069,500 in 2022 ($3,602,096 in 2021)
- Median Sales Price: (+3.8%) $3,010,000 in 2023 | $2,900,000 in 2022 ($2,286,060 in 2021)
- Average Sales Price Per SQ/FT: (+14.6%) $1,195.04 in 2023 | $1,042.48 in 2022 ($764.06 in 2021)
- Median Sales Price Per SQ/FT: (+16.1%) $1,130.42 in 2023 | $973.45 in 2022 ($671.69 in 2021)
- Days on Market: 126 Average | 99 Median in 2023 (40 Average | 21 Median in 2022)
- Highest Priced Sale of 2023: 3323 Poinciana Ave. Closed on 10/19/2023 @ $18,000,000 (LAND SALE)
- Lowest Priced Sale of 2023: 4145 Bonita Ave. Closed on 04/10/2023 @ $1,120,000 ($1,258.43)
2023 vs. 2022 CENTER Coconut Grove Sales by the Numbers:
- Total Number of Sales: 157 in 2023 | 201 in 2022 (289 in 2021)
- Average List Price: $1,546,931 in 2023 | $1,209,295 in 2022 ($1,239,859 in 2021)
- Median List Price: $1,079,500 in 2023 | $850,000 in 2022 ($729,000 in 2021)
- Average Sales Price: (+25.9%) $1,477,797 in 2023 | $1,173,432 in 2022 ($1,184,823 in 2021)
- Median Sales Price: (+28.6%) $1,050,000 in 2023 | $816,563 in 2022 ($700,000 in 2021)
- Average Sales Price Per SQ/FT: (+18.2%) $884.52 in 2023 | $748.28 in 2022 ($614.85 in 2021)
- Median Sales Price Per SQ/FT: (+21.8%) $767.86 in 2023 | $630.58 in 2022 ($499.68 in 2021)
- Days on Market: 49 Average | 20 Median in 2023 (48 Average | 18 Median in 2022)
- Highest Priced Sale of 2023: Two Park Grove #UPH-A Closed on 07/13/2023 @ $17,500,000 ($2,526.35 per sq/ft)
- Lowest Priced Sale of 2023: 3245 Virginia St. #18 Closed on 06/26/2023 @ $255,000 ($496.11 per sq/ft)
2023 vs. 2022 WEST Coconut Grove Sales by the Numbers:
- Total Number of Sales: 49 in 2023 | 75 in 2022 (119 in 2021)
- Average List Price: $2,160,277 in 2023 | $1,630,657 in 2022 ($1,384,312 in 2021)
- Median List Price: $1,499,000 in 2023 | $1,237,562 in 2022 ($1,200,000 in 2021)
- Average Sales Price: (+30.1%) $2,049,373 in 2023 | $1,575,181 in 2022 ($1,329,108 in 2021)
- Median Sales Price: (+12.2%) $1,375,000 in 2023 | $1,225,000 in 2022 ($1,140,000 in 2021)
- Average Sales Price Per SQ/FT: (+6.6%) $784.52 in 2023 | $736.28 in 2022 ($540.77 in 2021)
- Median Sales Price Per SQ/FT: (-0.4%) $684.37 in 2023 | $686.81 in 2022 ($494.14 in 2021)
- Days on Market: 58 Average | 40 Median in 2023 (50 Average | 31 Median in 2022)
- Highest Priced Sale of 2023: 3258 Bird Ave. Closed on 06/30/2023 @ $16,000,000 (BULK SALE – 8 TOWNHOMES)
- Lowest Priced Sale of 2023: 3741 Thomas Ave. Closed on 10/30/2023 @ $575,000 ($735.29 per sq/ft)
If you, or someone you know, would like to purchase or sell real estate in Coconut Grove, please contact me, Michael Light, Founder/Owner of the Light Group at Douglas Elliman Real Estate. I am a resident of Coconut Grove and have direct knowledge of the Coconut Grove real estate market. You may reach me directly at my CocoWalk office at 786-566-1700 or via email at michael@201813.com.
Looking for past Coconut Grove market statistic articles? Here they are:
2022 Coconut Grove Market Report
2021 Coconut Grove Market Report
2020 Coconut Grove Market Report
2019 Coconut Grove Market Report
2018 Coconut Grove Market Report
2017 Coconut Grove Market Report
2016 Coconut Grove Market Report
2015 Coconut Grove Market Report
2014 Coconut Grove Market Report